
You’ve probably seen the charts. One day a new coin is up 50%, the next it’s down because someone sold their entire bag. It feels random, but it’s rarely luck. The secret sauce behind price action often lies in something boring on paper: token supply and distribution. If you don’t understand how many tokens exist and who holds them, you’re gambling, not investing.
| Concept | Why It Matters |
|---|---|
| Circulating vs. Total Supply | Low circulation means high future dilution risk when locked tokens unlock. |
| Vesting Schedules | Longer lockups for insiders reduce immediate sell pressure. |
| Inflation Rate | High issuance rates can erode value if demand doesn't keep pace. |
The Three Numbers You Must Know
Most beginners look at the price. Smart investors look at the supply metrics. There are three specific numbers that dictate a token's economic reality, and mixing them up is a rookie mistake.
First is circulating supply. This is the number of coins actually out in the wild, trading on exchanges, and held by users. It excludes tokens sitting in team wallets, treasury reserves, or locked in smart contracts waiting to be released. Why does this matter? Because market capitalization is calculated using this number alone. If a token has a low circulating supply but a huge total supply, its current market cap might look small, but it’s about to get much bigger as those hidden tokens flood the market.
Next is total supply. This includes everything created so far, whether it’s circulating or still locked away. Think of it as the inventory in the warehouse plus what’s on the shelves. If a project has minted 1 billion tokens but only 100 million are circulating, you have a massive amount of "supply overhang" waiting to hit the market.
Finally, there’s maximum supply. This is the hard cap-the absolute most tokens that will ever exist. Bitcoin is the classic example here, with a fixed max supply of 21 million BTC. Once we hit that number, no more Bitcoin will be created. Ethereum, on the other hand, has no maximum supply cap, though it uses burning mechanisms to control inflation. Knowing which model a project follows helps you predict long-term scarcity versus potential inflation.
How Tokens Enter the Market
Tokens don’t just appear out of thin air evenly. They enter circulation through specific mechanisms, and the speed and method of this entry drive volatility.
Bitcoin introduced the concept of halving. Every four years, the reward for mining a block gets cut in half. In 2009, miners got 50 BTC per block. Today, it’s significantly less. This programmed scarcity creates predictable, decreasing inflation. It’s a deflationary pressure built into the code.
Other projects use different tricks. Some rely on staking rewards, where new tokens are issued to validators who secure the network. If the annual issuance rate is 5% but demand grows by 10%, the price can still rise despite inflation. But if demand stalls while issuance continues, the price drops. That’s why you need to check the annual inflation rate, not just the total supply.
Then there’s the burn mechanism. Projects like BNB or Avalanche (AVAX) take a portion of transaction fees and destroy those tokens permanently. This reduces the circulating supply over time. If a project burns tokens faster than it mints new ones, it becomes deflationary. During periods of high network activity, Ethereum has occasionally become net-deflationary due to its EIP-1559 burn feature, removing millions of ETH from existence.
Distribution: Who Holds the Power?
Supply tells you how many tokens exist. Distribution tells you who owns them. This is arguably more critical for short-to-medium term price action. If 80% of the supply is held by five people, one person selling can crash the chart.
Look for the breakdown between insiders and the public. Insiders include founders, the core team, early private investors, and advisors. The public includes retail buyers, community members, and ecosystem participants. A healthy project usually aims for a balanced distribution. However, many newer projects launch with heavy insider allocations-sometimes exceeding 30-40% of the total supply.
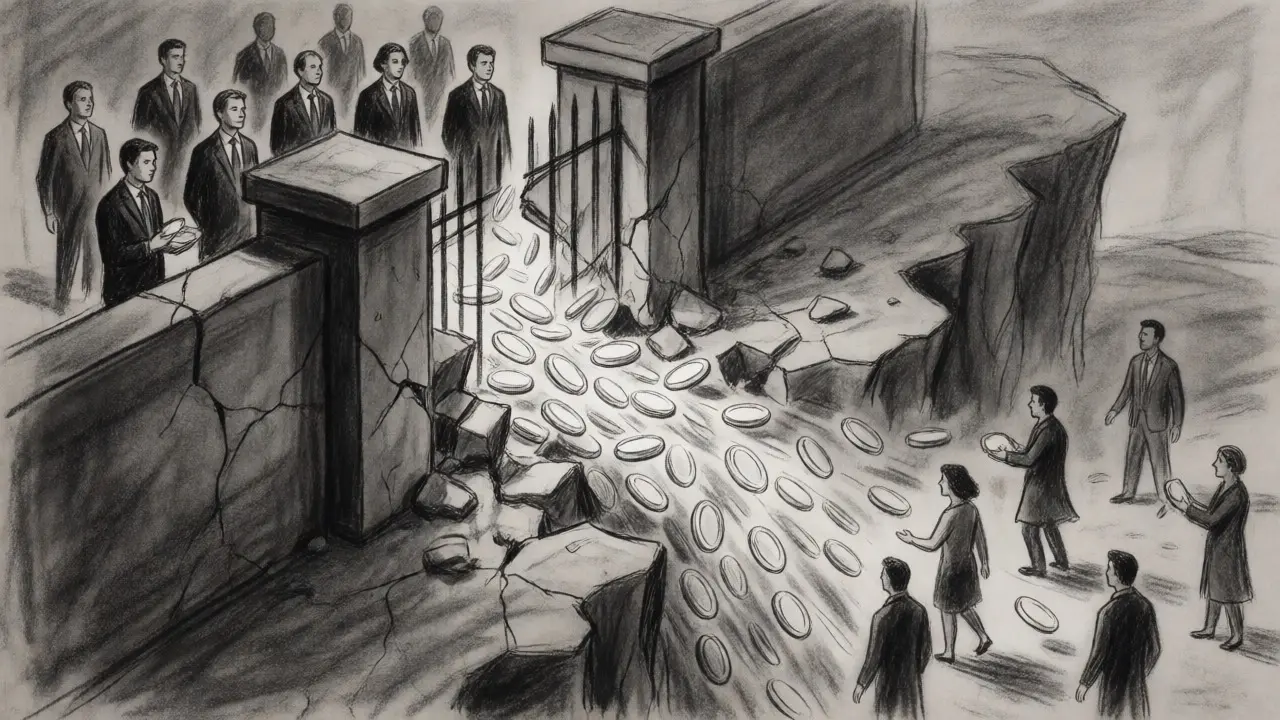
Why is this risky? Because insiders bought in cheaply. When their tokens unlock, they often sell to realize profits, regardless of the market sentiment. If a large chunk of insider tokens unlocks all at once, you’ll likely see a sharp price dip. This is known as a "cliff." Conversely, if the distribution is spread out over several years with gradual unlocks, the sell pressure is smoothed out, making for a more stable price environment.
Vesting Schedules: The Anti-Dump Shield
A vesting schedule dictates when locked tokens become liquid. It’s the primary tool used to align incentives. Without vesting, early investors could dump their holdings immediately after listing, leaving retail holders holding the bag.
Here’s what a typical good structure looks like:
- Cliff: An initial period (e.g., 6-12 months) where no tokens are released. This ensures commitment during the build phase.
- Linear Vesting: After the cliff, tokens release gradually (e.g., monthly or quarterly) over 2-4 years.
- Team Allocation: Often subject to the longest vesting periods (3-4 years) to prevent founder exits.
- Public Sale: Usually unlocked immediately or with a very short cliff to provide liquidity.
Data shows that projects with graded vesting schedules experience significantly lower volatility in their first year compared to those with immediate full unlocks. If you see a project with a 4-year vesting schedule for the team, that’s a green flag. It suggests the builders aren’t planning to cash out tomorrow.
Reading the Unlock Calendar
Tools like TokenUnlocks or Messari allow you to visualize upcoming supply events. You should always check these before buying. Imagine you buy a token at $1.00. Two weeks later, 10% of the total supply unlocks for early investors. Those investors now have billions of dollars worth of tokens available to sell. Even if they only sell 10% of their stack, the market impact could drop the price to $0.80.
Keep an eye on the ratio of circulating to total supply. A general rule of thumb: if less than 50% of the total supply is circulating, be cautious. The remaining 50%+ represents future dilution. As those tokens enter the market, the market cap must grow proportionally just to keep the price flat. If demand doesn’t match that growth, the price falls.

Real-World Examples
Let’s look at two contrasting models to see how this plays out in reality.
Bitcoin (BTC): Fixed max supply of 21M. No pre-mine. Fair launch via mining. Distribution is highly decentralized over time. Because the supply enters the market slowly and predictably, and no single entity controls a massive chunk, BTC acts as a store of value. Its scarcity narrative is backed by math, not promises.
Ethereum (ETH): No max supply, but dynamic issuance. Post-Merge, issuance dropped drastically. Combined with burning, ETH often sees net deflation. Distribution started with an ICO (where some early adopters hold significant amounts), but the transition to Proof-of-Stake has distributed rewards to thousands of validators globally. The burn mechanism offsets inflation, creating a complex but generally sustainable economic model.
Contrast this with many altcoins launched in 2021. Many had 70-80% of supply allocated to insiders and VCs, with only 20% circulating. When the vesting cliffs hit in 2022 and 2023, prices collapsed. The fundamentals didn’t change; the supply dynamics did.
Common Pitfalls to Avoid
Don’t fall for these traps:
- Ignoring the FDV: Fully Diluted Valuation (FDV) assumes all tokens are circulating. If a token has a $1B market cap but a $10B FDV, it’s massively overvalued relative to its actual circulation.
- Trusting "Fair Launches": Just because there was no ICO doesn’t mean it’s fair. Check if the team mined a large portion early on.
- Overlooking Treasury Funds: Large treasuries can be used for marketing or dumping. Check governance proposals to see how the treasury is being spent.
Final Thoughts on Sustainability
Tokenomics isn’t just about hype; it’s about sustainability. A project with a clear, transparent, and gradual supply schedule signals maturity. It shows the developers respect the market mechanics. On the flip side, opaque distributions and aggressive insider allocations scream "exit liquidity." Before you invest, spend ten minutes checking the supply data. It might save you from a six-month sideways grind or a sudden 50% drop.
What is the difference between circulating supply and total supply?
Circulating supply refers to the number of tokens currently available and actively traded in the market. Total supply includes all tokens that have been created, including those that are locked, reserved for the team, or held in treasury, regardless of whether they are currently tradeable.
Why does a high circulating-to-total supply ratio matter?
A high ratio (e.g., >80%) means most tokens are already in the market, reducing the risk of future dilution. A low ratio (<50%) indicates a large amount of locked tokens will eventually enter circulation, potentially increasing sell pressure and lowering the price if demand doesn't increase accordingly.
What is a vesting cliff?
A vesting cliff is a set period at the beginning of a token distribution schedule during which no tokens are released to investors or team members. After the cliff ends, tokens typically begin to unlock linearly over time. Cliffs help ensure stakeholders remain committed to the project long-term.
Does a fixed maximum supply guarantee price appreciation?
No. While a fixed max supply (like Bitcoin's 21 million) creates scarcity, price appreciation also depends on demand. If demand stagnates or declines, even a scarce asset can lose value. Scarcity is a necessary condition for long-term value storage but not sufficient on its own.
How do token burns affect supply?
Token burns permanently remove tokens from circulation by sending them to an address from which they cannot be retrieved. This reduces the circulating supply, which can increase scarcity and potentially drive up the price if demand remains constant or increases.