
Ever wondered why Bitcoin seems to explode in value every few years only to crash shortly after? It isn't just random chaos. If you look at the data from the last decade, Bitcoin moves in remarkably predictable waves. These Bitcoin bull runs is periods of sustained rapid price growth characterized by explosive upward movements followed by significant corrections are the heartbeat of the cryptocurrency market. For anyone trying to time their entry or manage risk, understanding these cycles is the difference between riding the wave and getting wiped out.
The Engine Behind the Surge: The Halving Event
To understand why Bitcoin spikes, you have to understand the Bitcoin Halving . This is a built-in piece of code that cuts the reward for miners in half every four years. Think of it as a programmed supply shock. When the amount of new Bitcoin entering the market drops, but demand stays the same or grows, the price naturally feels upward pressure.
Historically, we've seen this play out in 2012, 2016, 2020, and most recently on April 20, 2024. Each of these events has acted as a starting gun for a new growth phase. While the Bitcoin bull runs aren't instant, the halving usually sets the stage for the massive rallies that follow 6 to 18 months later.
Breaking Down the Historical Cycles
Not every bull run is the same. As the market matures, the drivers shift from "internet curiosity" to "global financial asset." Let's look at how the game has changed over time.
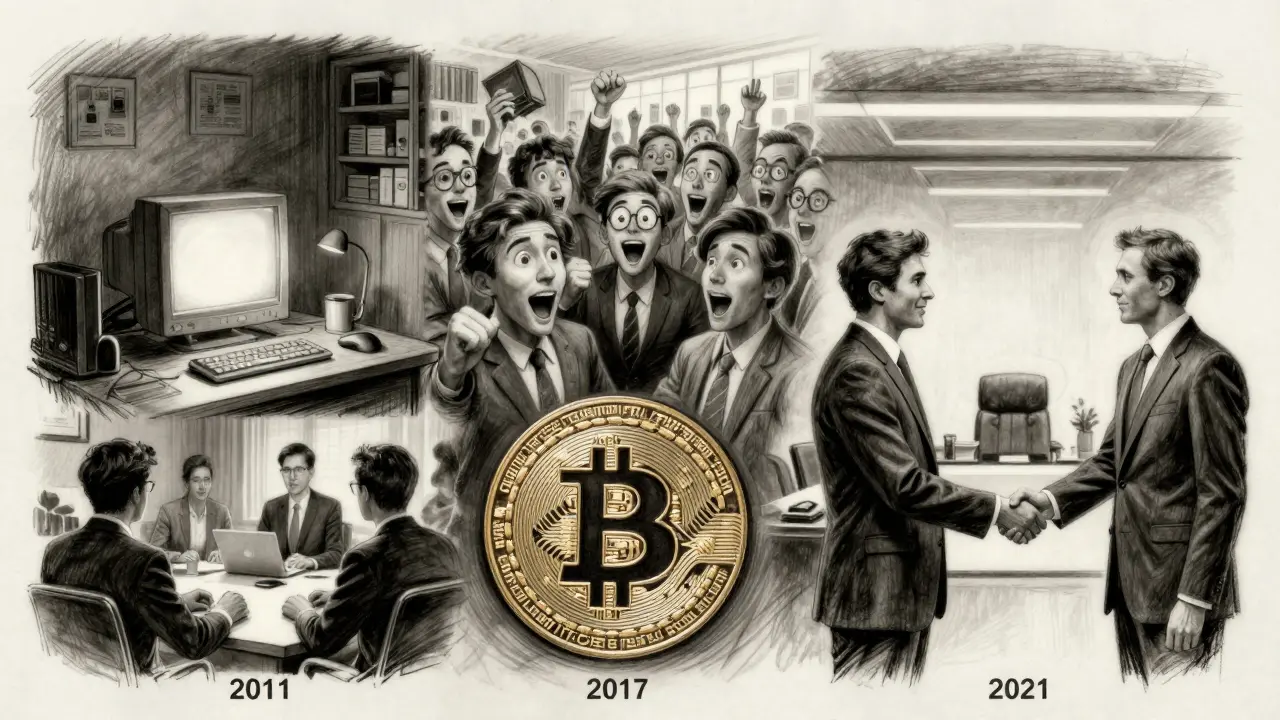
The 2013 Early Adoption Phase
The first major run was wild. Bitcoin climbed from around $145 in May 2013 to nearly $1,200 by December. This was the era of the early adopter. Much of the momentum was driven by the Cyprus banking crisis, which pushed people to look for alternatives to traditional banks. However, it was also the era of the Mt. Gox collapse, where users realized that keeping funds on a single exchange was a recipe for disaster. The crash that followed was brutal, with prices dropping over 75% in 2014.
The 2017 Retail Mania and ICOs
Fast forward to 2017, and the narrative shifted. This run was fueled by the Initial Coin Offering (ICO) boom. Suddenly, everyone wanted a piece of the action. Bitcoin surged from $1,000 in January to a peak of $20,000 in December. This cycle introduced the world to Ethereum and the idea that blockchain could do more than just move money. It was a period of irrational exuberance where retail FOMO (Fear Of Missing Out) pushed prices to unprecedented heights before the 2018 bear market set in.
The 2020-2021 Institutional Shift
The most recent complete cycle was a fundamental turning point. For the first time, the "big money" arrived. Companies like MicroStrategy and Tesla began adding Bitcoin to their balance sheets. This institutional adoption pushed Bitcoin from $8,000 to a peak of $69,000 in November 2021. Unlike previous runs, this one was backed by professional custody solutions and a deeper level of liquidity, though it still ended in a sharp correction to around $15,476 by late 2022.
| Cycle Peak | Primary Driver | Approx. Price Increase | Key Event |
|---|---|---|---|
| 2013 | Early Adoption / Cyprus Crisis | ~730% | Mt. Gox Collapse |
| 2017 | Retail FOMO / ICO Boom | ~1,900% | Ethereum Rise |
| 2021 | Institutional Adoption | ~762% | Tesla/MicroStrategy buys |
| 2024-26 | Spot ETFs / Maturing Finance | TBD | US Spot ETF Approval |
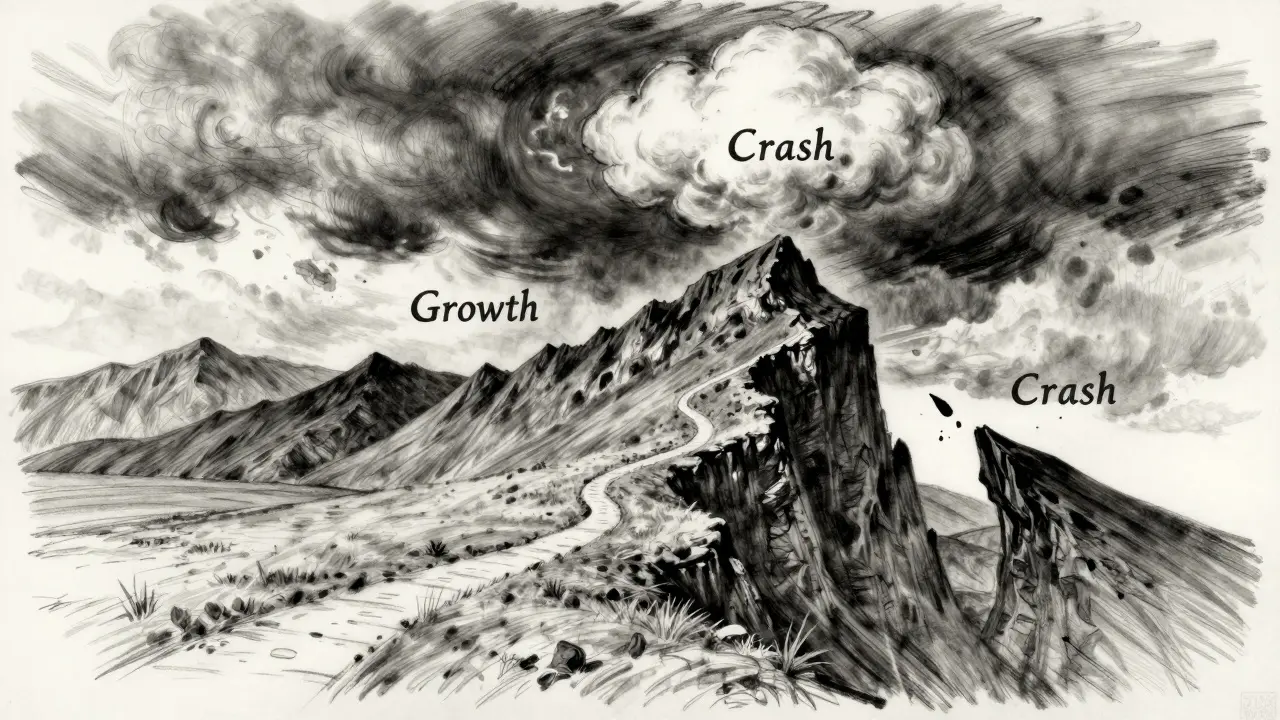
The Four Phases of the Market Cycle
If you want to stop emotional trading, you need a map. Most experts break these cycles into four distinct phases. Understanding which one we are in helps you decide whether to buy, hold, or exit.
- Accumulation: This is the "boring" phase. Prices move sideways near the bottom. Sentiment is bearish, and most people have given up. This is where the smartest money quietly buys.
- Growth: The trend turns positive. Prices start climbing toward previous highs, usually coinciding with a halving event. The public starts noticing, but the move is still sustainable.
- Bubble: This is the danger zone. Prices go parabolic, blowing past all-time highs. You'll see the Fear & Greed Index flashing "Extreme Greed." This is where most retail traders buy in at the top.
- Crash: The bubble pops. Corrections are often violent, typically seeing 78-80% drawdowns from the peak. This cleans out the leverage and resets the cycle.
The New Era: Why the 2024 Cycle is Different
Is history repeating itself? Yes and no. The 2024 halving brought something entirely new to the table: Spot Bitcoin ETFs . In the past, getting Bitcoin into a pension fund or a corporate account was a nightmare. Now, it's as easy as buying a stock.
By November 2024, these ETFs had accumulated over 850,000 BTC. This creates a massive amount of permanent demand that didn't exist in 2013 or 2017. We are also seeing the implementation of the MiCA regulation in the EU, which provides the legal clarity institutional investors crave. Because the market is more mature, we might see lower volatility than the 1,900% spikes of the past, but the price floors are becoming much higher.
Practical Tools for Tracking the Next Move
You don't need to be a math genius to track these patterns. There are a few concrete metrics you can watch to gauge where we are in the cycle:
- Bitcoin Dominance: When Bitcoin's share of the total crypto market rises, it usually signals the early-to-mid growth phase. When it drops sharply, "Altcoin Season" has likely arrived.
- Exchange Reserves: If the amount of Bitcoin sitting on exchanges is dropping, it means people are moving coins to cold storage. This is a bullish sign as it reduces immediate selling pressure.
- Hash Rate: A rising hash rate shows that miners are investing in more hardware, signaling long-term confidence in the network's security and value.
For those who prefer quantitative data, tools like the Bitcoin Bull Run Index (CBBI) combine multiple metrics to give a real-time assessment of the current phase. It's a much better approach than relying on a "gut feeling" or a random tip from a social media thread.
Does the 4-year cycle always happen?
While the 4-year pattern tied to the halving has held up since 2009, it is not a law of physics. As the market grows and more institutional money enters, the cycle could "lengthen" or dampen. However, the supply shock of the halving remains a fundamental economic driver that historically leads to bull runs.
When does a bull run typically peak?
Historically, Bitcoin peaks roughly 12 to 18 months after the halving event. For the April 2024 halving, analysts from firms like Standard Chartered suggest a peak could occur between Q4 2025 and Q1 2026.
How can I avoid buying the top?
Watch for signs of the "Bubble Phase": extreme greed on sentiment indexes, parabolic price moves that deviate wildly from the 200-day moving average, and a sudden surge in mainstream media coverage. Using a Dollar Cost Averaging (DCA) strategy during the Accumulation phase is generally the safest way to build a position.
What is the difference between a bear market and a crash?
A crash is a rapid, violent drop in price (like the 77% drawdown in 2022). A bear market is the prolonged period of stagnation and slow decline that follows the crash, often lasting a year or more, where sentiment remains pessimistic until the next Accumulation phase begins.
Will the 2024-2026 run reach $200,000?
Some analysts, including those at Standard Chartered, believe $200,000 is possible based on the influx of ETF capital. Others are more conservative, citing the law of diminishing returns (where each single cycle produces a smaller percentage gain than the previous one). The actual result will likely depend on global macroeconomic conditions and US interest rates.
What to Do Now
If you're just getting started, avoid the temptation to "ape in" during a vertical price move. Instead, look at the historical data: the biggest gains are always made by those who accumulate when the market is boring and fearful. Start by monitoring exchange reserves and the Fear & Greed Index. If the market is in a state of extreme greed, it might be time to take some profits rather than adding to your position. If you're an experienced trader, focus on the rotation of capital from Bitcoin to altcoins, which typically signals the late stages of a bull run.
The rudimentary nature of this analysis is frankly exhaustive. It completely ignores the nuance of liquidity preference and the stochastic nature of volatility clustering in high-frequency trading environments. Relying on a simple four-year halving narrative is essentially painting a complex macroeconomic tapestry with a crayon. One must account for the reflexive nature of price action and the systemic impact of the Fed's balance sheet contraction before claiming any pattern is "predictable." This is surface-level observation masquerading as quantitative insight.
I think it's a pretty fair overview for anyone trying to get their head around the basics without getting bogged down in too many charts!
everyone knows the 4 year cycle is basically a myth now because the etfs changed the game entirely and the old data just doesnt apply anymore
Imagine actually believing that a piece of code can predict wealth. It's basically a digital religion for people who can't handle the reality of a centralized world. We're just trading one master for another, pretending the "supply shock" is some divine law when it's really just a psychological trick to keep the bagholders hoping for a moon shot that'll never come because the whales will dump on your head the second they smell blood in the water.
Buy the dip now or stay poor! 🚀🇺🇸 Only losers wait for the a-cycle to finish 📈💰
Oh sure, let's just trust the "predictable waves" while the BlackRock suits are basically vacuuming up all the supply in the background. I love how we treat this like a science project when it's actually just a giant game of musical chairs played by billionaires. Total genius move to use a 2013 metric to predict 2025, truly peak analysis right there. Sarcasm aside, the ETF inflow is the only thing that actually matters now.
It is far too convenient that the "regulations" like MiCA are arriving just as the institutional players want total control over the flow of assets. They want us to think this is a natural evolution of finance, but it's just a way to integrate crypto into the same surveillance system they've used for decades. The halving is a distraction from the fact that they are building a digital cage for our wealth and calling it "market maturity." Just watch how quickly the "predictable" cycles change when the government decides they want a back door into every wallet.
scam money 🙄
I appreciate the effort to simplify this. It can be so overwhelming for a lot of people to start out, and having a map really helps lower the anxiety levels. :)
Great breakdown! For those just starting, don't forget that DCA is your best friend to keep your emotions in check. Stay patient and keep learning! 🌟🙌
omggg i literally bought at the top in 2021 and i still cant believe i did that lol i am such a mess!! 😭 pls tell me i'll actually break even someday!!
It is so important to remember that while the numbers and the percentages can look very exciting on a table, the most important part of this journey is the emotional discipline you build along the way because if you cannot handle a 20% drop in a single day without panicking, then the 1,900% gains from previous years will not matter because you will likely sell at the first sign of trouble, so please take your time and only invest what you are truly comfortable losing in the long run.
When we look at these cycles, we are really looking at the collective psychology of humanity and our eternal struggle with greed and fear, which is why the "Bubble Phase" is so fascinating because it reflects our innate desire to belong to something larger than ourselves, even if that something is a speculative asset. I believe that as we transition into a more institutional era, we aren't just changing who buys Bitcoin, but we are changing the very nature of how we perceive value in a digital age, and that shift requires a level of mindfulness that transcends simple profit-taking or timing the market based on a four-year clock.
Totally agree with the focus on exchange reserves! When the coins leave the exchanges, the real party starts. Let's get those gains! 🚀🔥
I've always wondered if the halving is actually the cause or if it's just the catalyst that makes people pay attention to it again.